Investigative Phenomena: Is my local waterway healthy? Is the water quality the same at various points along the waterway? What impacts water health?
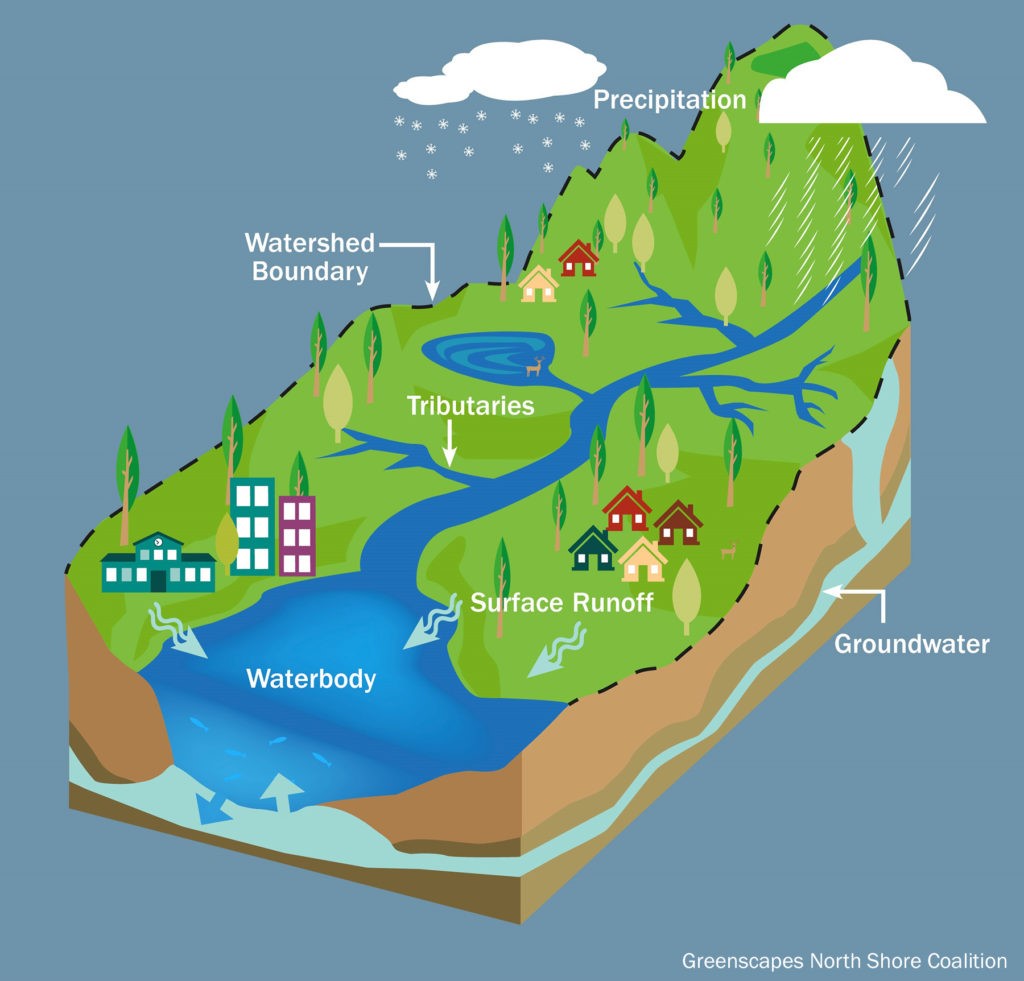
Perhaps you’ve been curious about the water you walk or drive by on a daily basis, or perhaps it’s just part of your scenery that you happen to take for granted. Take a deeper dive into the data and learn more about your ecosystem by measuring some of the following factors: flow, turbidity, dissolved oxygen, pH, temperature, salinity, ammonia, and nitrogen levels. Compare parts of your Maine watershed tributary, including upstream and downstream sites, as well as urban and agricultural areas. Find out the nutrient content of the water body and see if it will maintain balance between algae and other organisms along the river and as it approaches the ocean.
Next Generation Science Standards
Performance Expectation: MS-ESS3-3
Science and Engineering Practices: Analyzing and Interpreting Data
Disciplinary Core Ideas: MS-ESS2.C The Roles of Water in Earth’s Surface Processes
Crosscutting Concepts: Cause and Effect, Energy and Matter
Each scientific project has protocols and steps that need to be followed to make sure we account for scientific accuracy.
Log in to contribute data to your class or community project:
To view the list of projects that have been completed within Fresh to Salt: Flowing Together, click the button below. Students and community members can use this available data to compare with their project data. Analyzing trends within a watershed can give us clues to the overall health of the watershed.
Students are currently busy in the classroom and out in the field collecting data as part of our pilot year. As their projects wrap up, we will post their results and you will be able to access them here.